 PD Digital Image Correlation
PDDIC on the DIC Challenge 2.0
PDDIC was benchmarked against the DIC Challenge 2.0 star image sets — the published reference test for measuring how accurately a 2D digital image correlation code resolves rapidly varying displacement and strain. It matches the exact theoretical behavior for its class of code and places inside the band of results reported for the codes that took part.
Why this test
Any measurement tool is only as trustworthy as its independent validation. The DIC Challenge 2.0 star images are the strongest published test available for 2D-DIC, because they come with a known correct answer and they probe both halves of the problem at once: how fine a detail the software can resolve, and how much random error it carries while doing it.
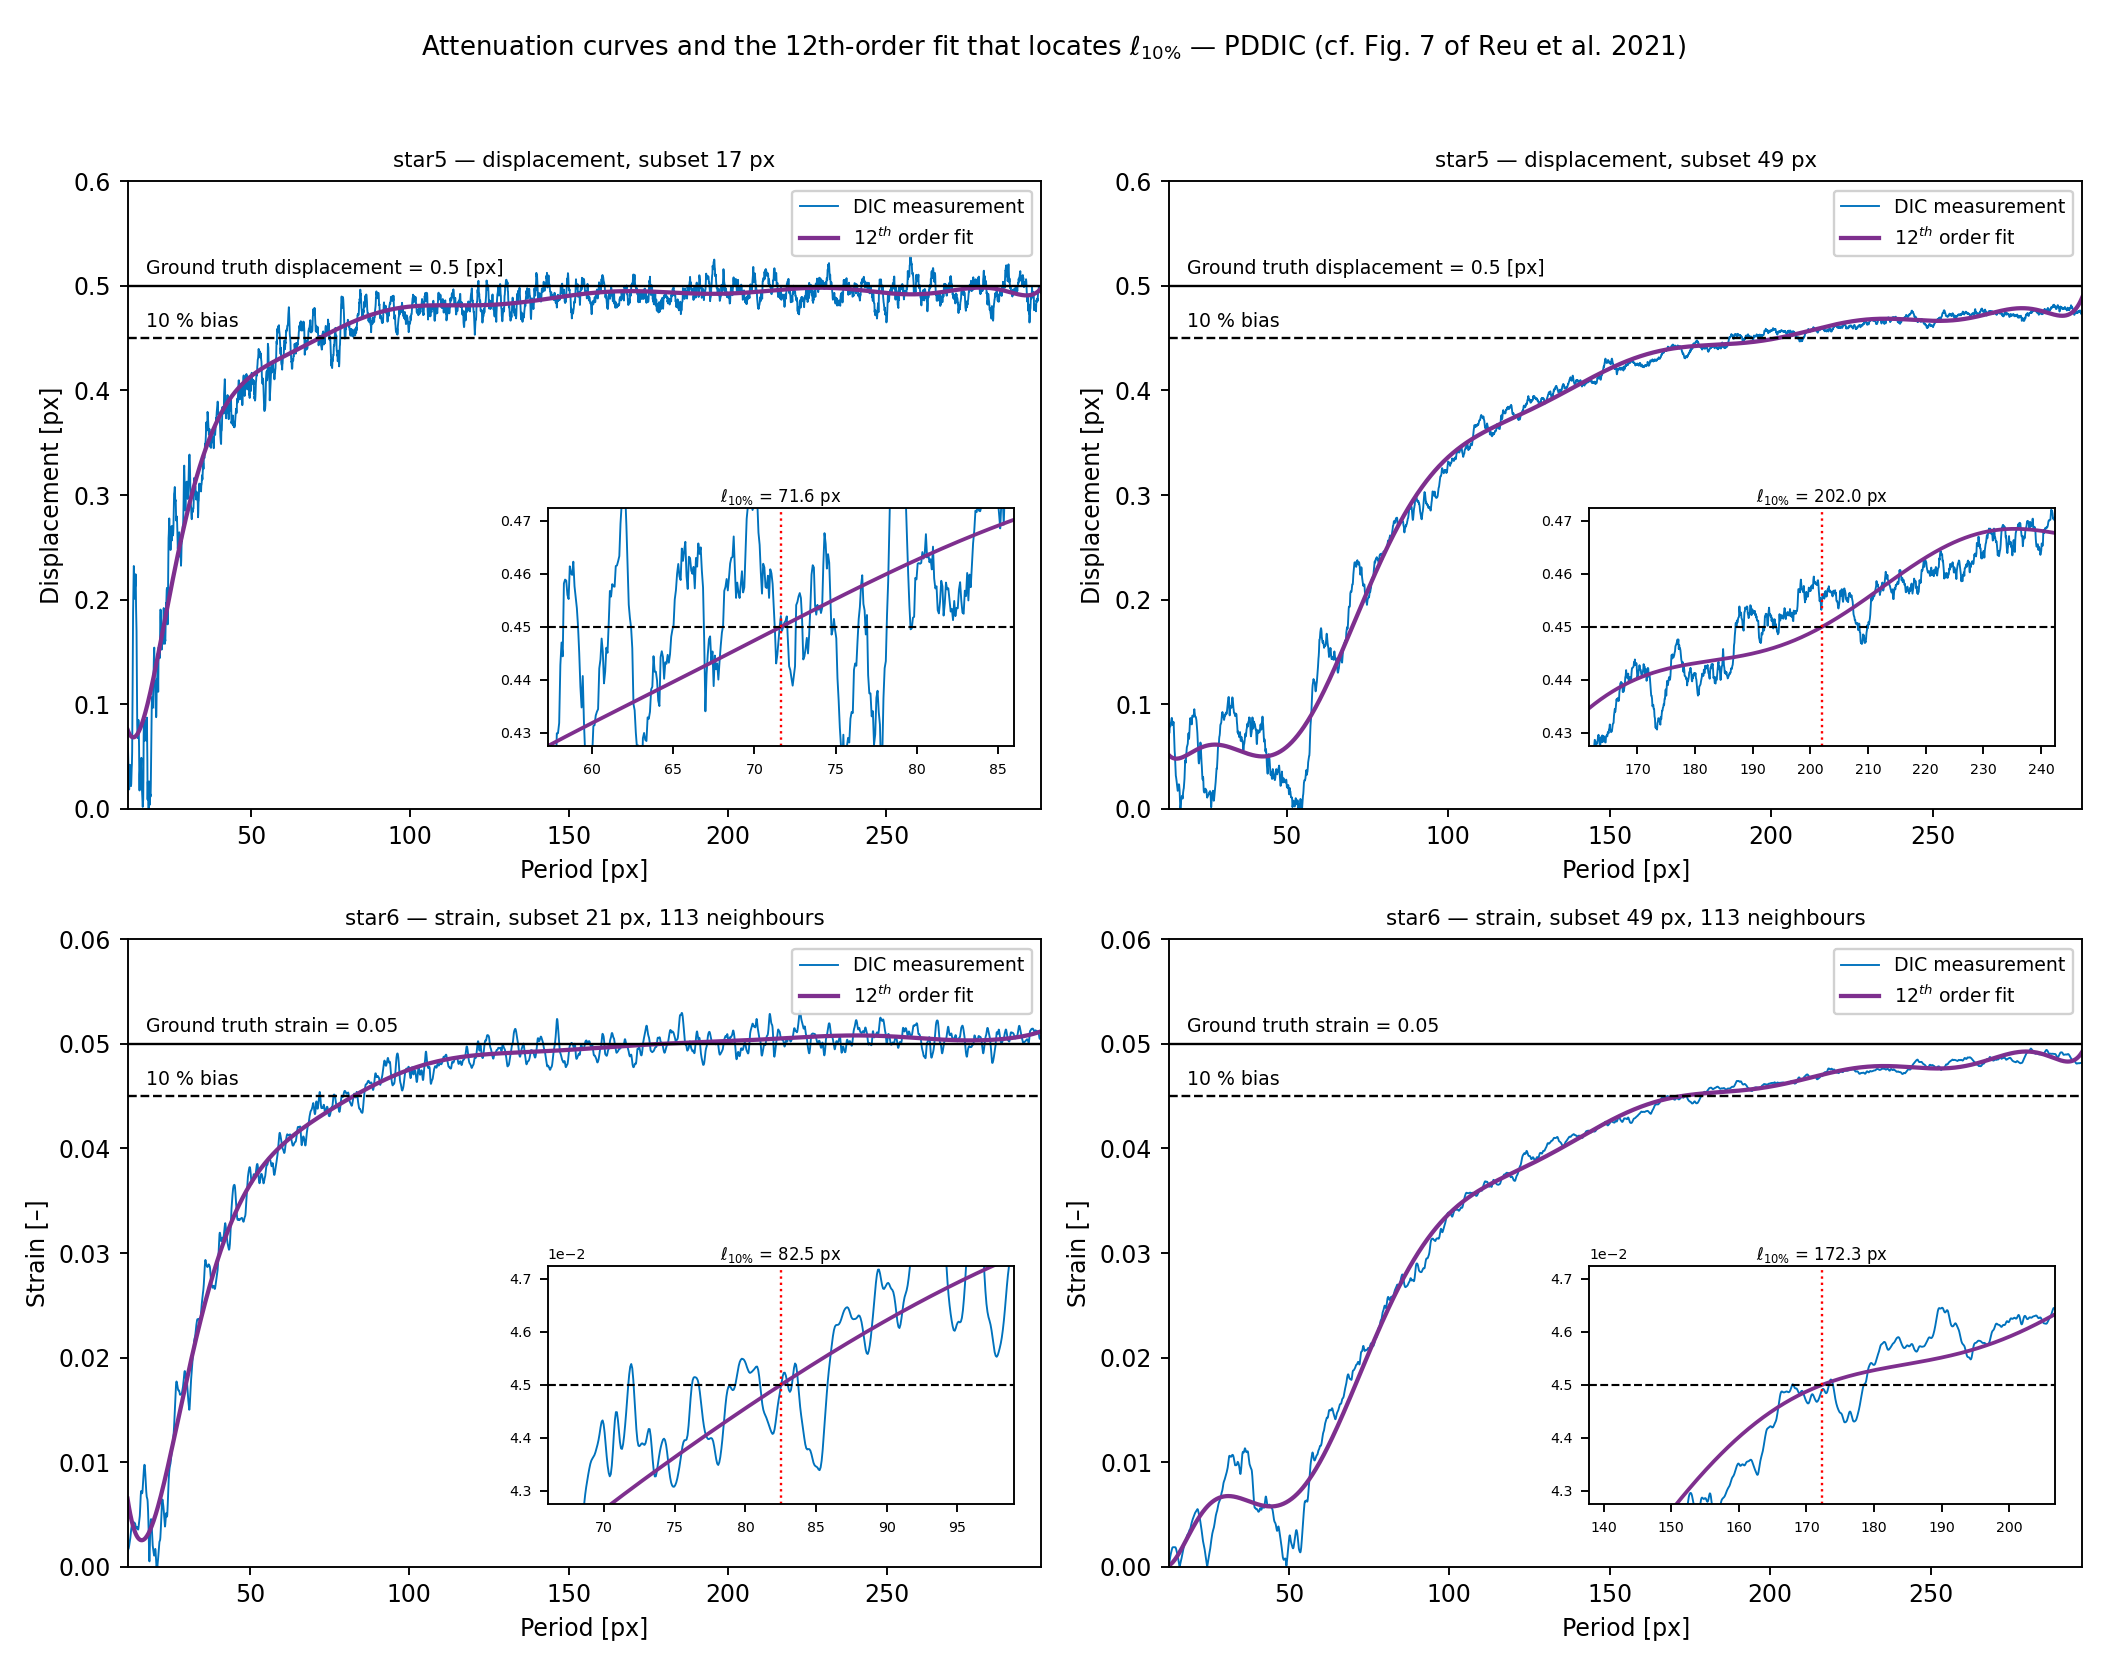
Each star image contains a wave pattern that runs across the picture. On the left the wave is tight and fast. On the right it is long and slow. A single image therefore tests the software across the full range from fine detail to coarse. The pattern is built so that along the middle row the true answer is the same everywhere — 0.5 pixels of movement, or 5 % stretch. Anything reported below that value is error the software introduced, and the position across the image shows how fine the detail was when that error appeared.
Two sets were used. Star 5 measures displacement. Star 6 measures strain. Both are the long 4000-pixel versions, and both ship a third image showing camera noise with nothing moving, which is what makes the measurement resolution measurable.
The three metrics
The challenge assesses metrological performance with three metrics, named here as they are named in the original work.
- Measurement resolution, n. The standard deviation of the reported quantity when nothing has actually moved — in plain terms, how much the answer wobbles at rest. Lower is better.
- Spatial resolution, ℓ10%. A cutoff period: the finest pattern the software still measures to within 10 % of the truth, given as a length in pixels. Lower is better.
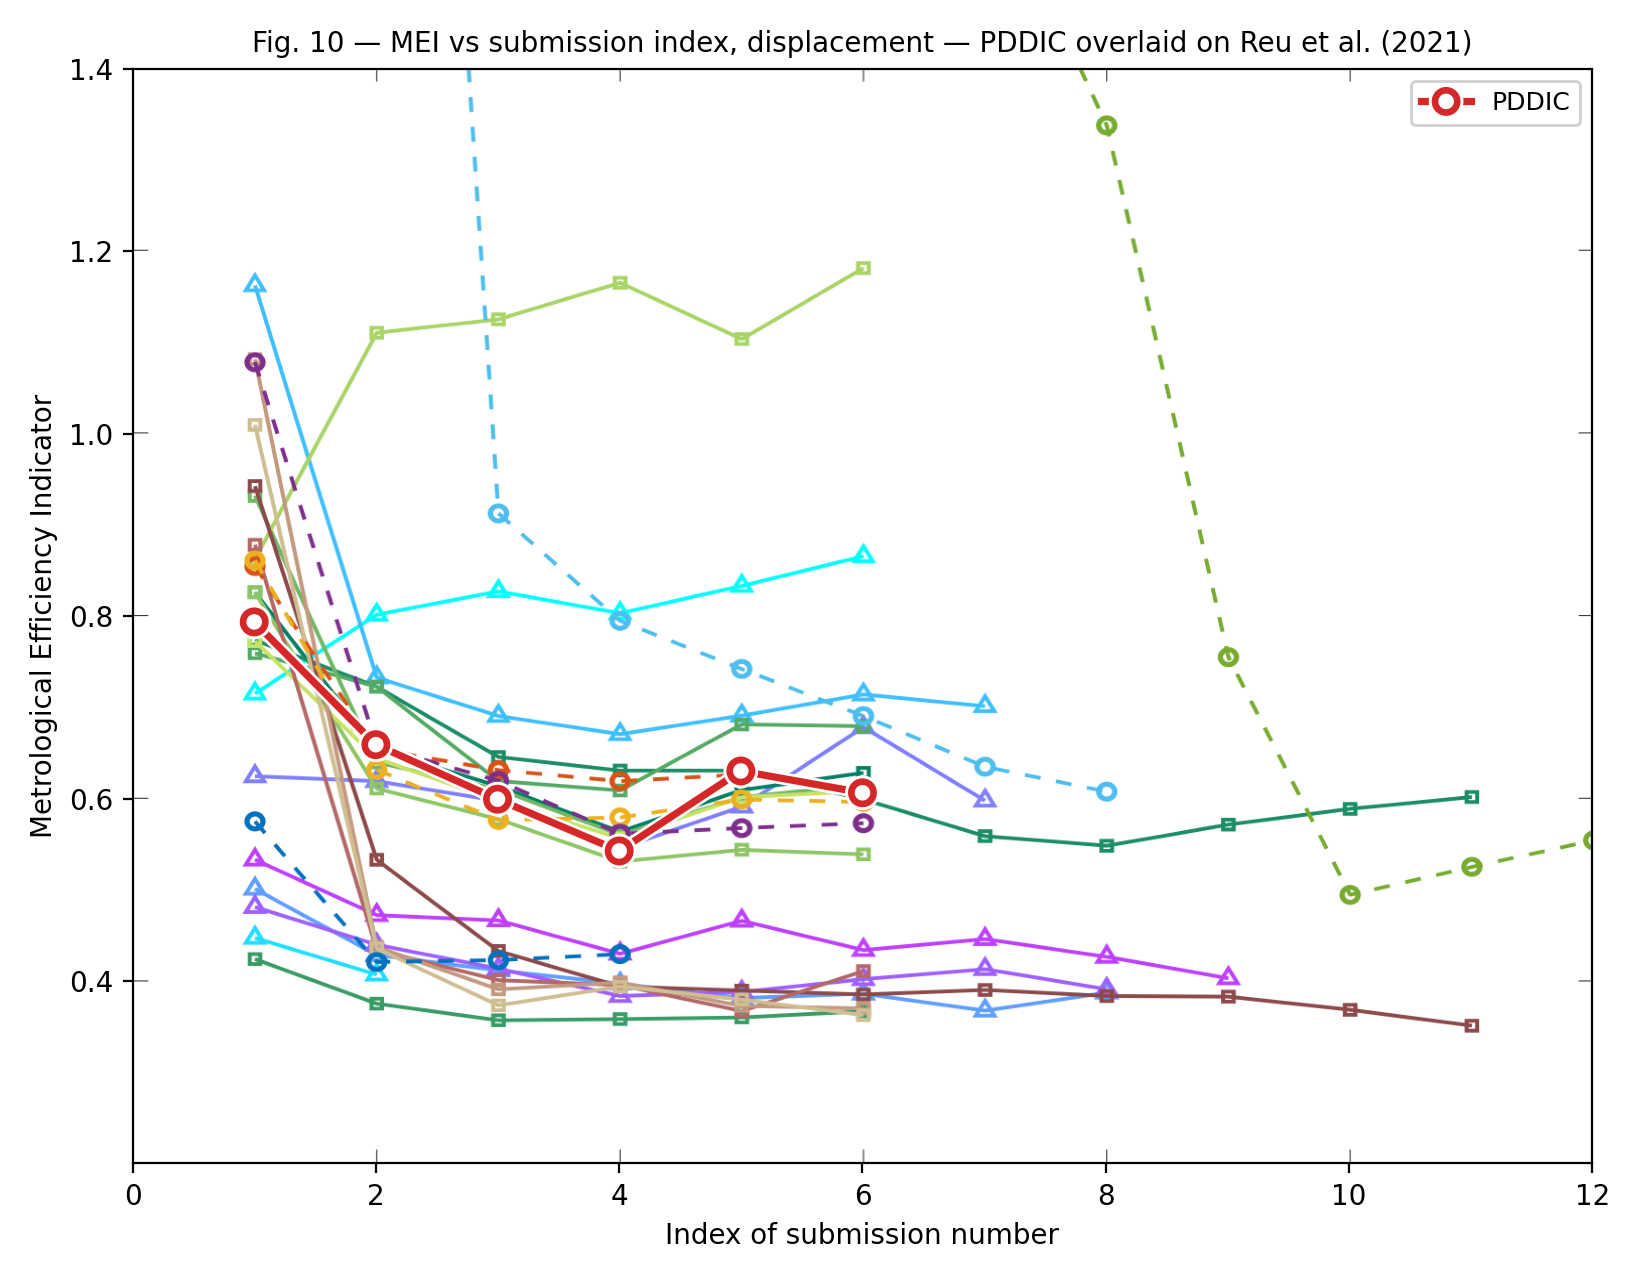
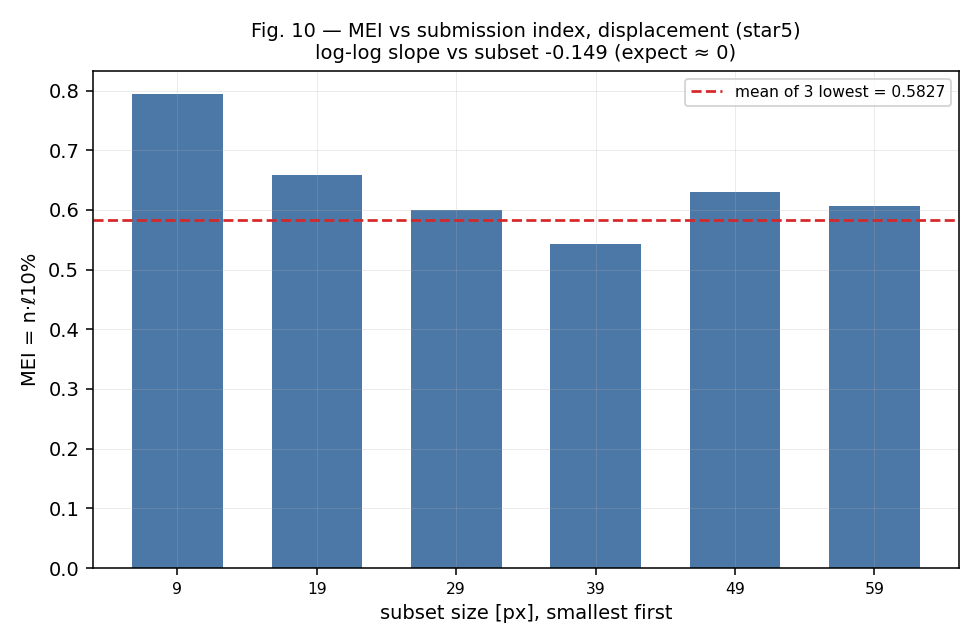
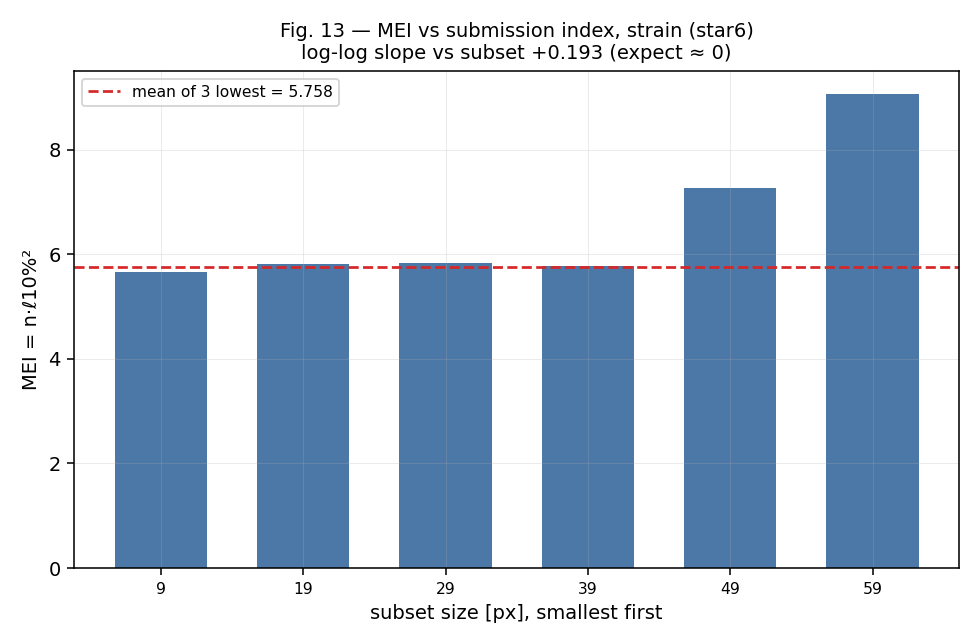
- Metrological Efficiency Indicator, MEI. The first two trade against each other, so either one alone can be improved by giving up the other. The MEI combines them so the trade cancels out. It stays the same whatever settings a code runs at, which is what lets two codes be compared fairly. Lower is better.
How PDDIC was configured
One setting was varied: the subset size, across the 9 to 59 pixel range the challenge asks local codes for. Everything else was held fixed. Results were read along the middle row of the image at single-pixel spacing, never stretched from a coarser output. Strain is Green–Lagrange throughout, which is the form the test images were built with. The spatial resolution comes from fitting a smooth curve through the measurements and reading off where it drops 10 % below the true value.
Results
| Subset [px] | n, displacement [px] | ℓ10%, displacement [px] | n, strain [–] | ℓ10%, strain [px] |
|---|---|---|---|---|
| 9 | 0.02165 | 36.7 | 0.003172 | 42.3 |
| 19 | 0.008405 | 78.4 | 0.0009969 | 76.4 |
| 29 | 0.005275 | 113.6 | 0.0004938 | 108.7 |
| 39 | 0.003564 | 152.2 | 0.000291 | 141.0 |
| 49 | 0.003119 | 202.0 | 0.0002447 | 172.3 |
| 59 | 0.002558 | 237.0 | 0.0001909 | 217.9 |
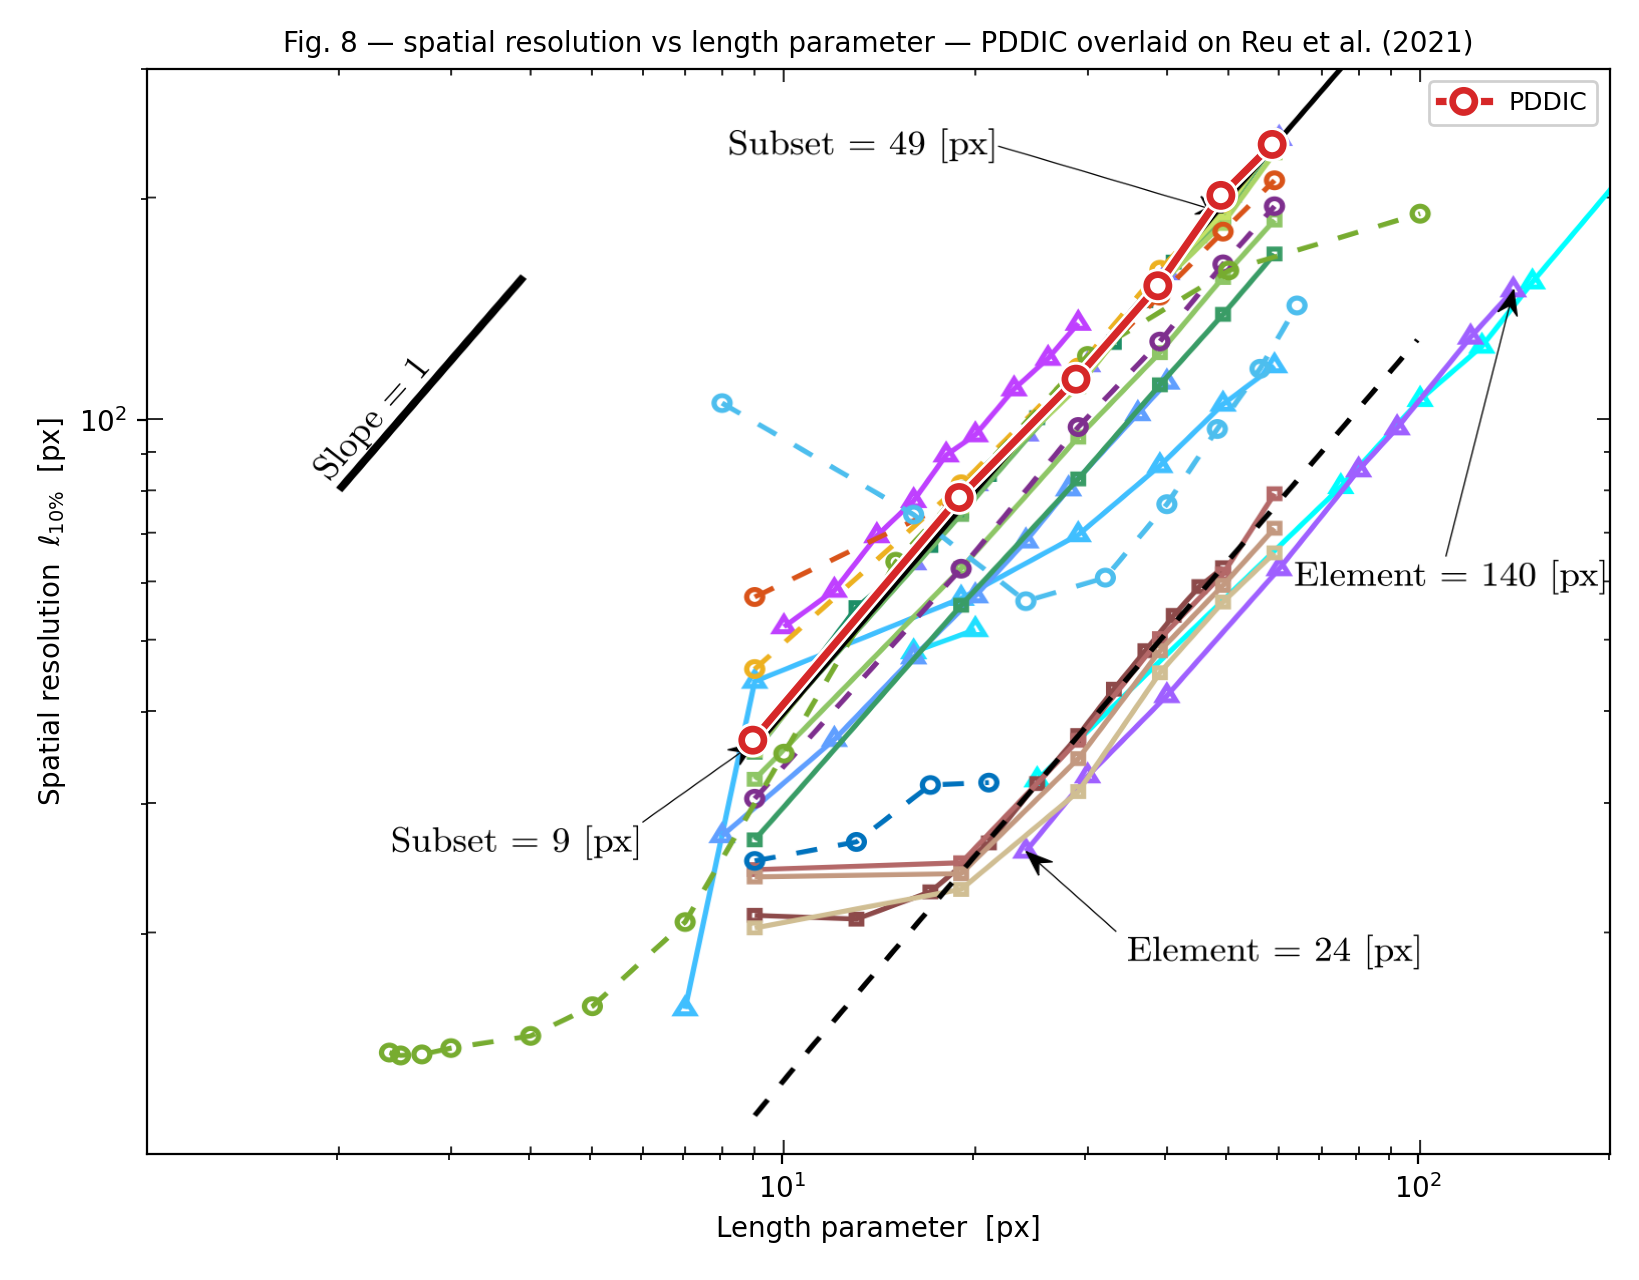
There is an exact formula for how a local DIC code of this type should behave: its spatial resolution should equal 3.99 times the subset size. PDDIC matches it. Across the whole range the measured value averages 1.008 times the formula — within 0.8 % of theory. On logarithmic axes the two follow the same straight line, with a measured slope of 0.991 against a theoretical 1.
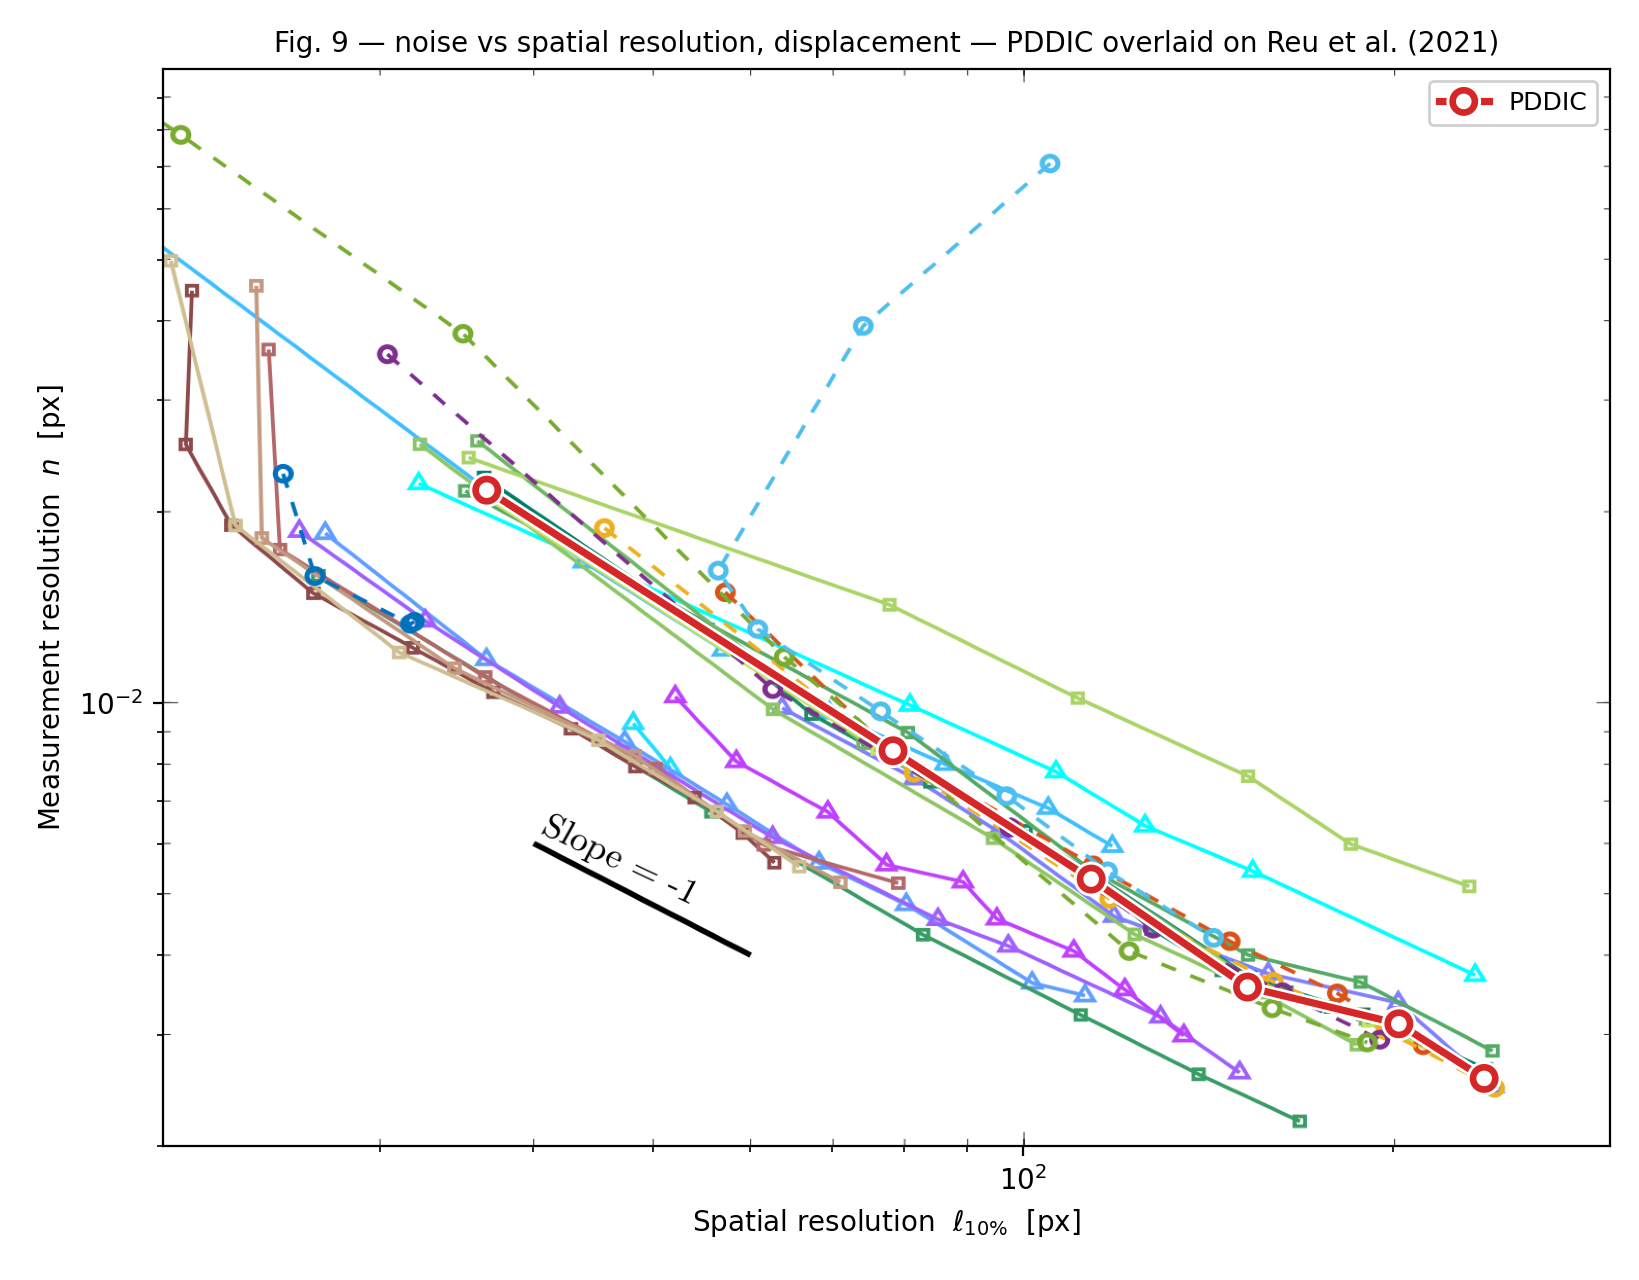
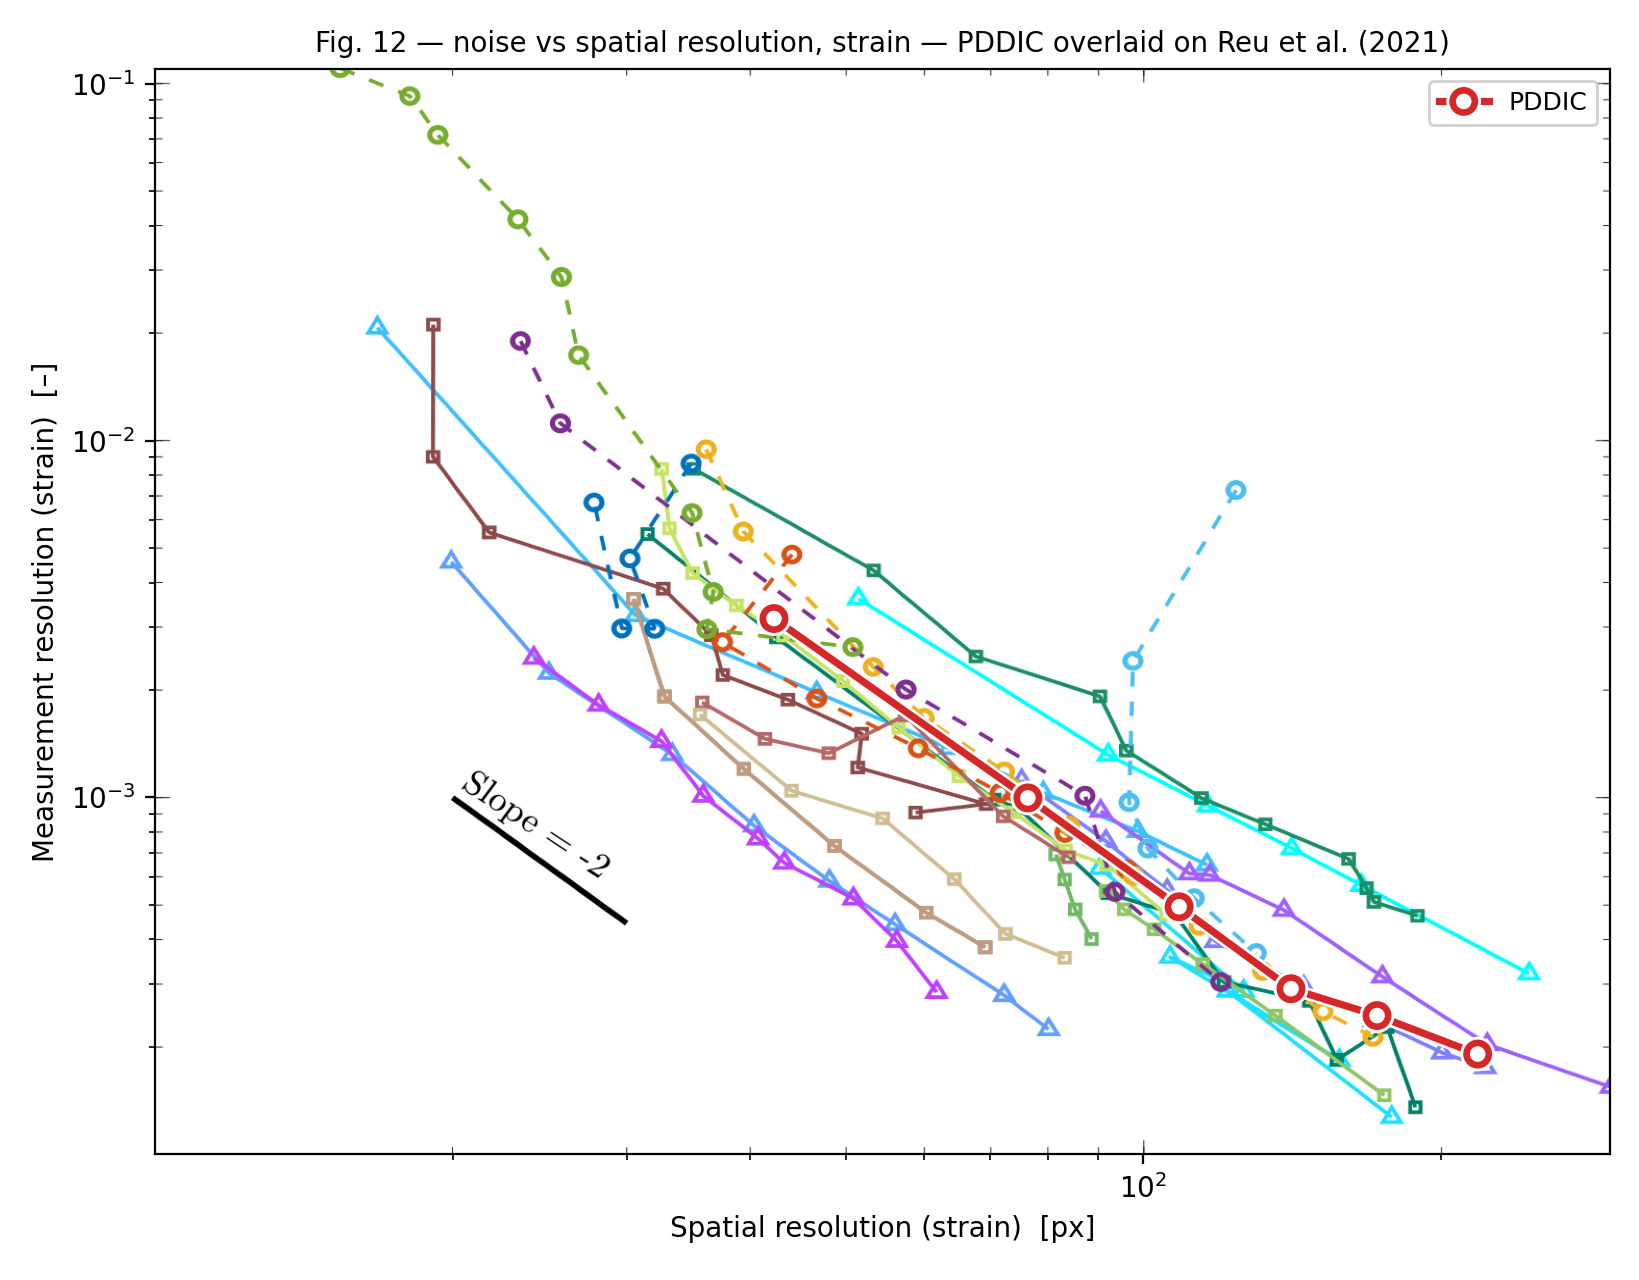
Measurement resolution and spatial resolution trade against each other as expected. The trade has a slope of −1.15 for displacement, close to the −1 the challenge reports for the participating codes, and −1.76 for strain against a reported −2. Both confirm the inverse relationship the benchmark is built on.
PDDIC placed among the published codes
The figures below are the published comparison plots from the challenge, with PDDIC drawn on top in red. The alignment is exact: the plot frame and axis scales were read directly from the vector content of the article, so both data sets share one coordinate system rather than being lined up by eye.
Metrological Efficiency Indicator
| Quantity | Best n | Best ℓ10% [px] | MEI | ℓ10% at n = 0.01 |
|---|---|---|---|---|
| Displacement (Star 5) | 0.00256 px | 36.7 | 0.5827 px² | 58.3 px |
| Strain (Star 6) | 0.000191 | 42.3 | 5.758 | 24.0 px |
How PDDIC compares
| What is compared | Challenge | PDDIC | Result |
|---|---|---|---|
| ℓ10% against subset size | slope 1 (equals 3.99 × subset) | 0.991 | matches |
| Measured ℓ10% ÷ theory | about 1 | 1.008 | on the theoretical line |
| n against ℓ10%, displacement | about −1 | −1.148 | inverse relationship confirmed |
| ℓ10% at a 17 px subset | 67.2 px measured by the reference code | 71.6 px | within 7 % of the reference code |
| MEI steady across settings | steady, apart from the smallest subset | −0.149 | steady |
| n against ℓ10%, strain | about −2 | −1.763 | matches |
The challenge quotes one setting directly: a 17-pixel subset, measured by the code it calls Local.Affine.B — one of the implementations it identifies as matching theory most closely. That code reported a spatial resolution of 67.2 pixels. PDDIC reports 71.6 pixels at the same setting, within 7 %. The challenge notes that most codes using the same kinematics fall within ±15 % of one another, so PDDIC sits inside the published band.
Conclusion
PDDIC passes the DIC Challenge 2.0 on every measure it defines.
- It reproduces the exact theoretical formula for this class of DIC code across subsets from 9 to 59 pixels, averaging 1.008 times theory. By the challenge's own standard, this is the behavior of a correct implementation.
- It follows both published trade-off trends: −1.15 for displacement against a reported −1, and −1.76 for strain against a reported −2.
- Its MEI stays level as the settings change — the benchmark's main check that a complete measurement chain is sound.
- Its headline MEI is 0.583 px² for displacement and 5.758 for strain. At a common measurement resolution of 0.01 that corresponds to a spatial resolution of 58 pixels in displacement and 24 pixels in strain.
- It sits inside the published band of results for codes of the same type, alongside the implementations the challenge identifies as matching theory most closely.
PDDIC therefore delivers accuracy on a par with established DIC software, while also providing non-local strain, geometry-aware handling of holes and notches, and automatic crack detection that the compared packages do not offer.
About PDDIC
PDDIC is a full-field measurement and damage analysis platform. It combines digital image correlation with the Peridynamic Differential Operator (PDDO) for displacement and strain, and adds a physics-driven crack detection engine on top. Displacement, strain, and crack location all come out of a single workflow. No mesh, no finite element model, and no sensors on the part.
- Track a few points, get every pixel. PDDIC needs no grid. It tracks a limited number of points chosen at random across the surface, then reconstructs the displacement at every pixel with PD Regression. Fewer tracked points means less matching work per frame — a saving that multiplies across a long test — and because each pixel is built from a whole neighborhood of tracked points, random errors partly cancel. The field comes out smooth with no separate filter to tune.
- Cleaner strain, and the stresses that follow. PDDIC computes strain with PDDO differentiation, fitting a smooth surface through a neighborhood of points and reading the slope from that fit. The neighborhood size is a single setting, so the trade-off between fine detail and smoothness stays in the user's hands instead of being hidden inside a filter.
- It finds cracks by itself. PDDIC maps the strain compatibility residual, converts it into a probabilistic damage index, and fits a smooth path through the crack candidates. The output is the crack location and shape, not just a suggestive color map.
- It respects holes and notches. Cut-outs are modeled explicitly, so points on the far side of a discontinuity are excluded from a pixel's neighborhood and displacement never blends across a physical boundary.
| Capability | PDDIC | GOM / VIC-2D | Ncorr | DICe |
|---|---|---|---|---|
| Dense full-field displacement | ✓ | ✓ | ✓ | ✓ |
| Works around holes and notches | ✓ | partial | — | — |
| Works from scattered points, no grid needed | ✓ | — | — | — |
| Non-local (PDDO) strain | ✓ | — | — | — |
| Adjustable smoothing radius for strain | ✓ | — | — | — |
| Strain compatibility residual map | ✓ | — | — | — |
| Probabilistic damage index | ✓ | — | — | — |
| Automatic crack-path detection | ✓ | — | — | — |
| Open, scriptable Python platform | ✓ | — | ✓ | ✓ |
Benchmark reference: P. L. Reu et al., “DIC Challenge 2.0: Developing Images and Guidelines for Evaluating Accuracy and Resolution of 2D Analyses — Focus on the Metrological Efficiency Indicator”, Experimental Mechanics, 2021. doi:10.1007/s11340-021-00806-6. Test images available from the Society for Experimental Mechanics at sem.org/dicchallenge. All figures on this page were produced by the standalone benchmark implementation, which reads the published image sets directly and reproduces every number shown here from a single command.