Peridynamic Digital Image Correlation
Full-field displacement and strain measurement with automated crack detection — from digital images alone.
About
Peridynamic Digital Image Correlation (PD-DIC) is an integrated software platform for full-field surface displacement and strain measurement from digital images. It combines classical subset-based Digital Image Correlation (DIC) tracking with the Peridynamic Differential Operator (PDDO) — a non-local, mesh-free mathematical framework — to deliver accurate, noise-robust displacement and strain fields across arbitrarily shaped domains containing holes, notches, or other geometric discontinuities.
When a specimen contains damage, PD-DIC extends the analysis with a physics-driven crack detection engine: the Saint-Venant strain compatibility condition is evaluated at every interior point, deviations from compatibility are converted into a probabilistic Damage Confidence Factor (CDF), and a regression model automatically predicts the continuous crack path through the damage zone. No mesh, no contact sensors, and no expert interpretation of the optical data are required.
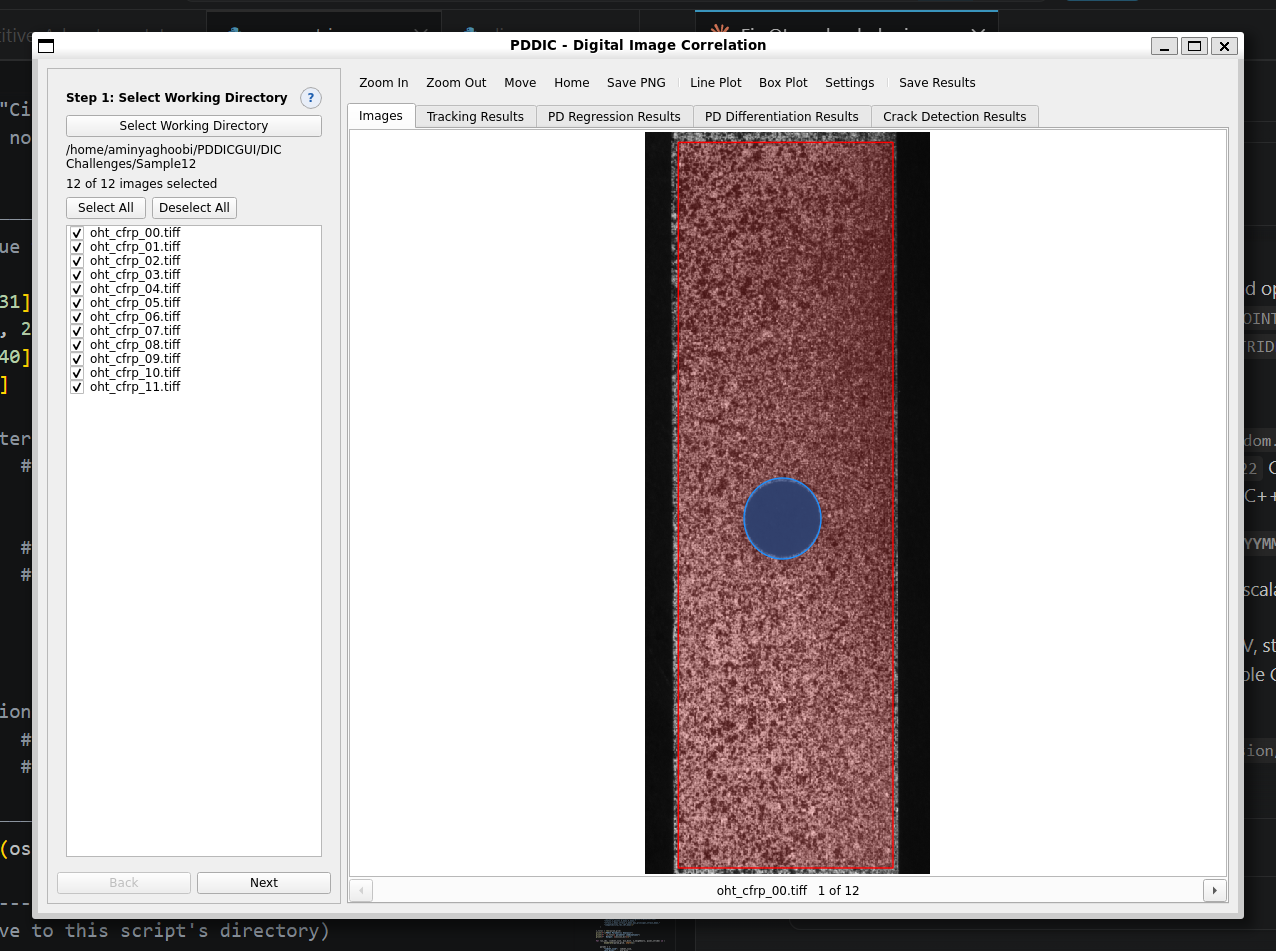 Steps 1–3. Image selection, analysis domain, and a circular cut-out defined directly on the reference image.
How It Works
Subset tracking measures displacements at thousands of randomly seeded surface points using normalised cross-correlation between the reference and deformed images. The zeroth-order PDDO then regresses these sparse vectors onto a dense pixel grid; points lying on the far side of a cut-out are excluded from each pixel's regression family by line-of-sight masking, so no displacement is artificially blended across a physical discontinuity.
Strains are obtained by applying the first-order PDDO directly to the dense displacement field. Because the PDDO integrates over a peridynamic horizon rather than differencing two adjacent points, it is inherently more noise-robust than the finite-difference schemes used by conventional DIC software and requires no artificial smoothing. Second-order PDDO derivatives then give the Saint-Venant compatibility residual, whose statistical outliers mark the kinematic discontinuities that signal a crack.
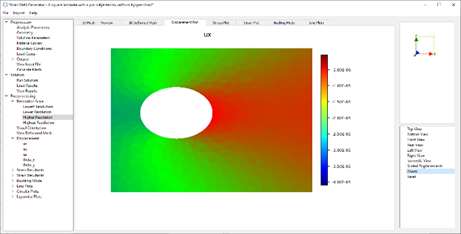
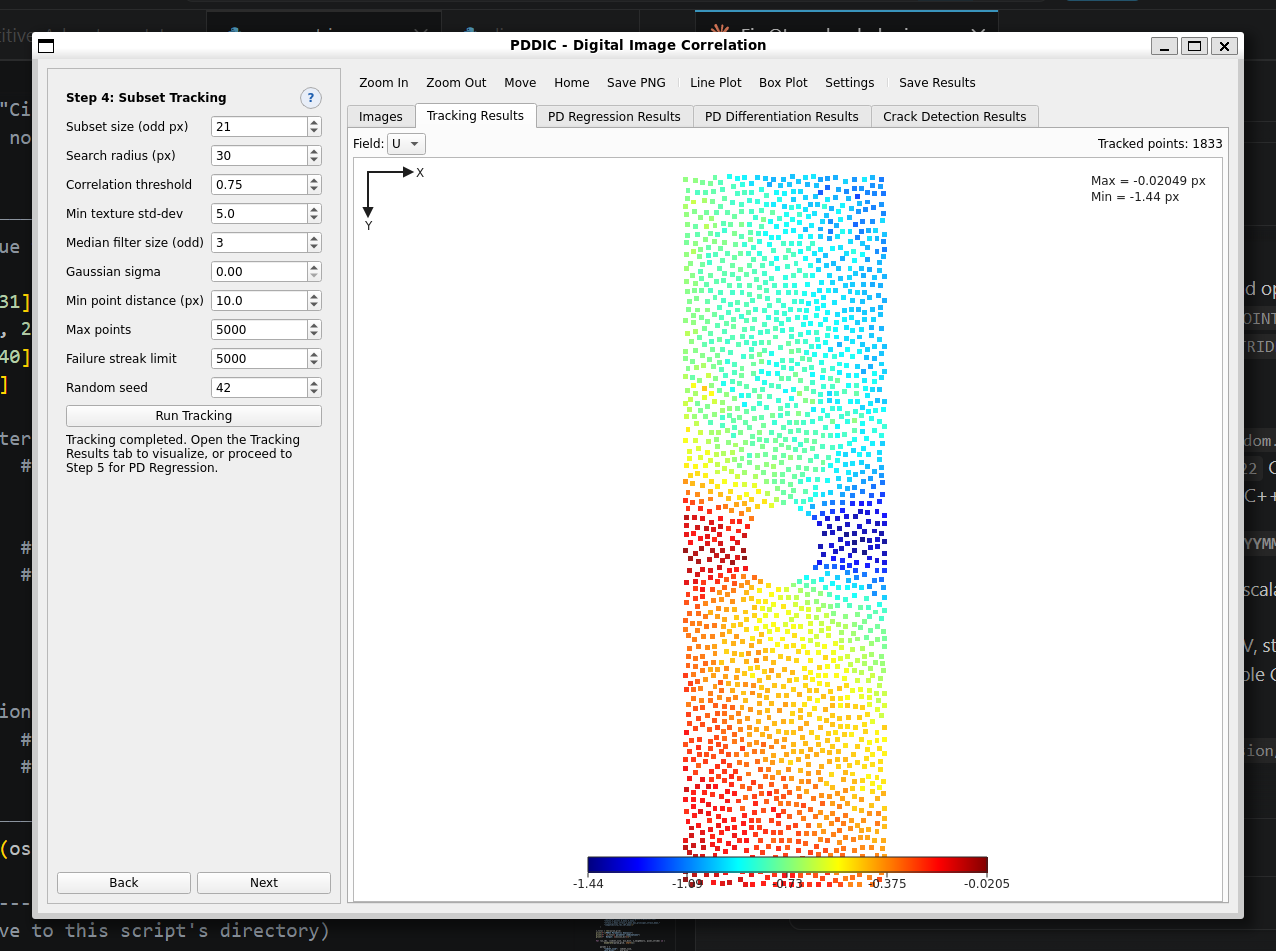 Step 4. Horizontal displacement U at the tracked subset centres, measured by normalised cross-correlation.
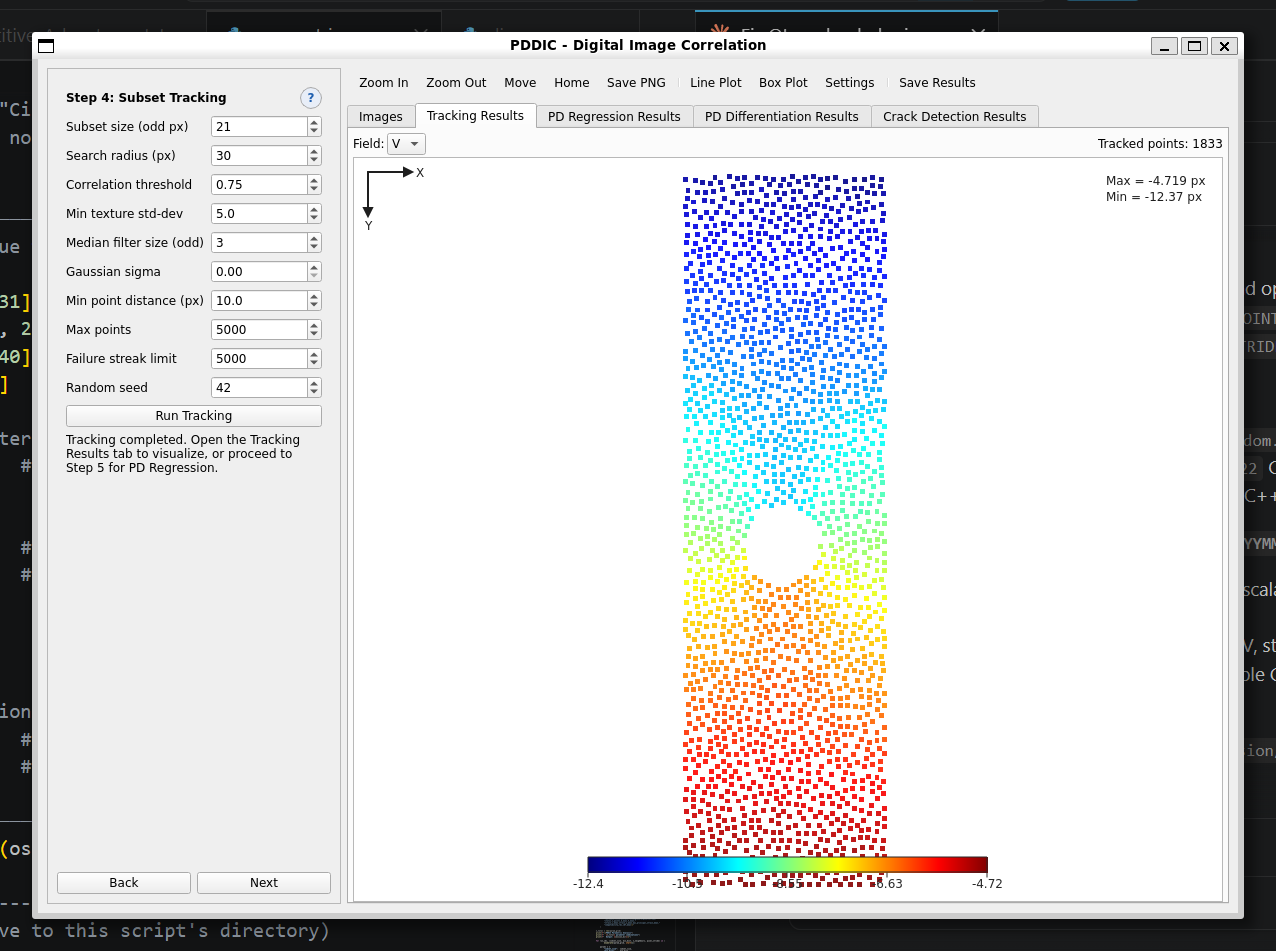 Step 4. Vertical displacement V over the same points — the hole is excluded, never interpolated across.
Analysis Pipeline
- Select working directory: load the reference and deformed images (TIF, PNG, JPG, BMP)
- Domain selection: draw or type the rectangular region of interest
- Cut-outs: exclude holes, notches, voids, and grip regions using rectangles or ellipses
- Subset tracking (DIC): normalised cross-correlation of randomly seeded subsets
- PD Regression: zeroth-order PDDO interpolation onto a dense, geometry-aware grid
- FD Strain: optional rapid finite-difference strain preview
- PD Differentiation: first-order PDDO strains, compatibility residual, and CDF
- Crack detection: boundary masking, CDF thresholding, DBSCAN, PCA, and spline regression
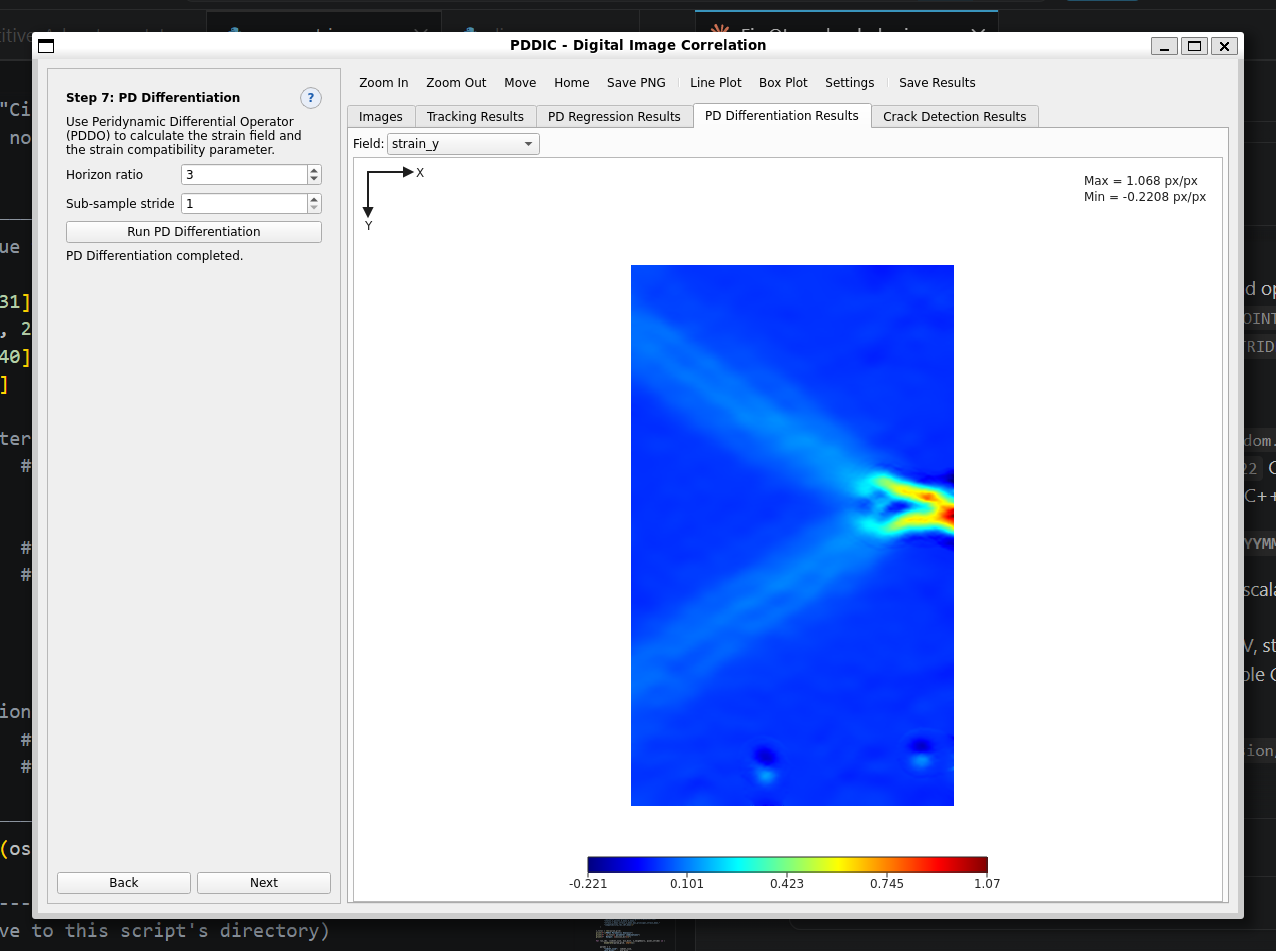 Step 7. Normal strain εy from first-order PDDO differentiation — damage at the hole edge resolves cleanly without smoothing.
Features
- Step-by-step graphical user interface with an interactive result canvas
- Works with any camera and any random speckle pattern
- Geometry-aware regression around holes, notches, and cut-outs
- Interactive pan and zoom on every result canvas
- Configurable colormaps (Jet, Jet_m, Viridis, Coolwarm), continuous or banded
- Automatic or manual colorbar range
- Unit conversion of displacement fields: px to µm, mm, cm, or m
- Line profile: extract field values along any cross-section
- Box or circle region: scatter-plot all field values inside a selected area
- Export of results to text, CSV, PNG, and NumPy .npz
- Headless parametric sweep script for batch parameter studies
- Open Python platform — scriptable and extensible
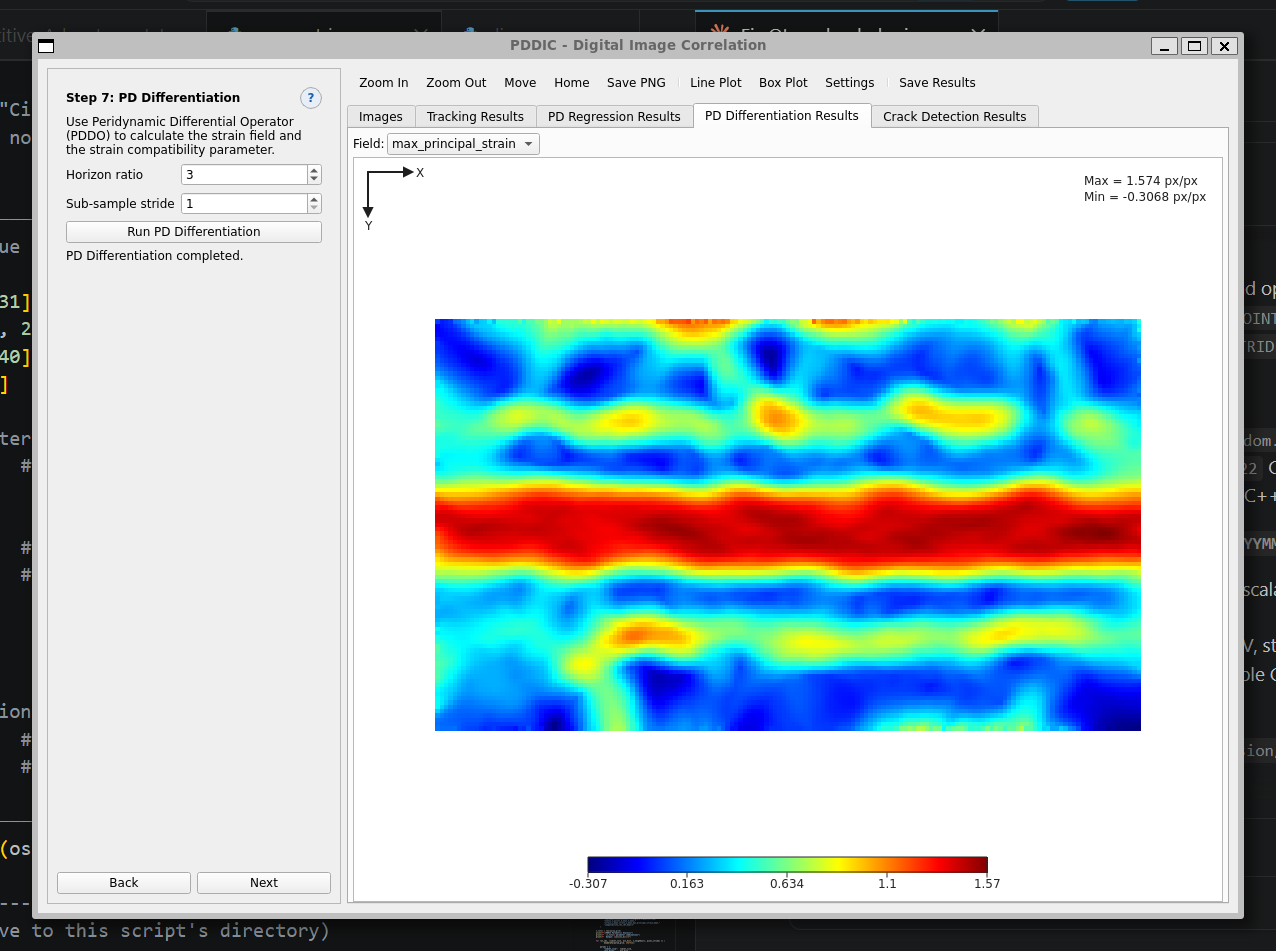 Step 7. Maximum principal strain, computed analytically from the full strain tensor at every point.
Capabilities
- Full-field displacements U and V from an image pair or sequence
- Dense displacement reconstruction at every pixel via PD Regression
- Noise-robust strains εx, εy, εxy from the first-order PDDO
- Maximum principal strain from the full strain tensor
- Saint-Venant compatibility residual as a physical damage indicator
- Probabilistic Damage Confidence Factor (CDF) at every interior point
- Automated crack path via DBSCAN clustering, PCA, and smoothing splines
- Multiple cut-outs of mixed shapes propagated through all analysis steps
- Tunable horizon ratio, pixel stride, and sub-sample stride
- Export of all fields for downstream fracture mechanics post-processing
Crack Detection
Points within four times the point spacing of the domain boundary or any cut-out perimeter are masked out first, removing the artefacts caused by truncated peridynamic neighbourhoods. The compatibility residuals of the remaining interior points are standardised and converted to a two-tailed p-value — the Damage Confidence Factor. Points falling below the CDF threshold are flagged as crack candidates.
DBSCAN then isolates the densest cluster of candidates and discards scattered noise, PCA identifies the dominant crack direction, and a density-weighted smoothing spline fits a continuous curve through the cluster. The result is a smooth, physically plausible crack path ready for stress intensity factor or J-integral post-processing — produced without any prior knowledge of the crack's position, orientation, or length.
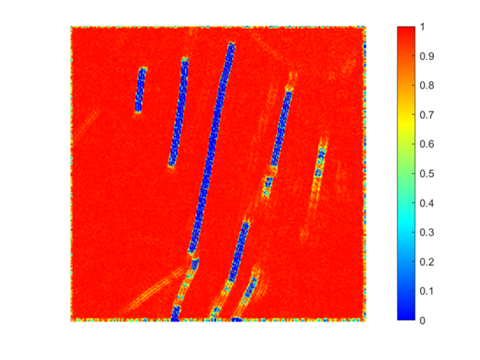
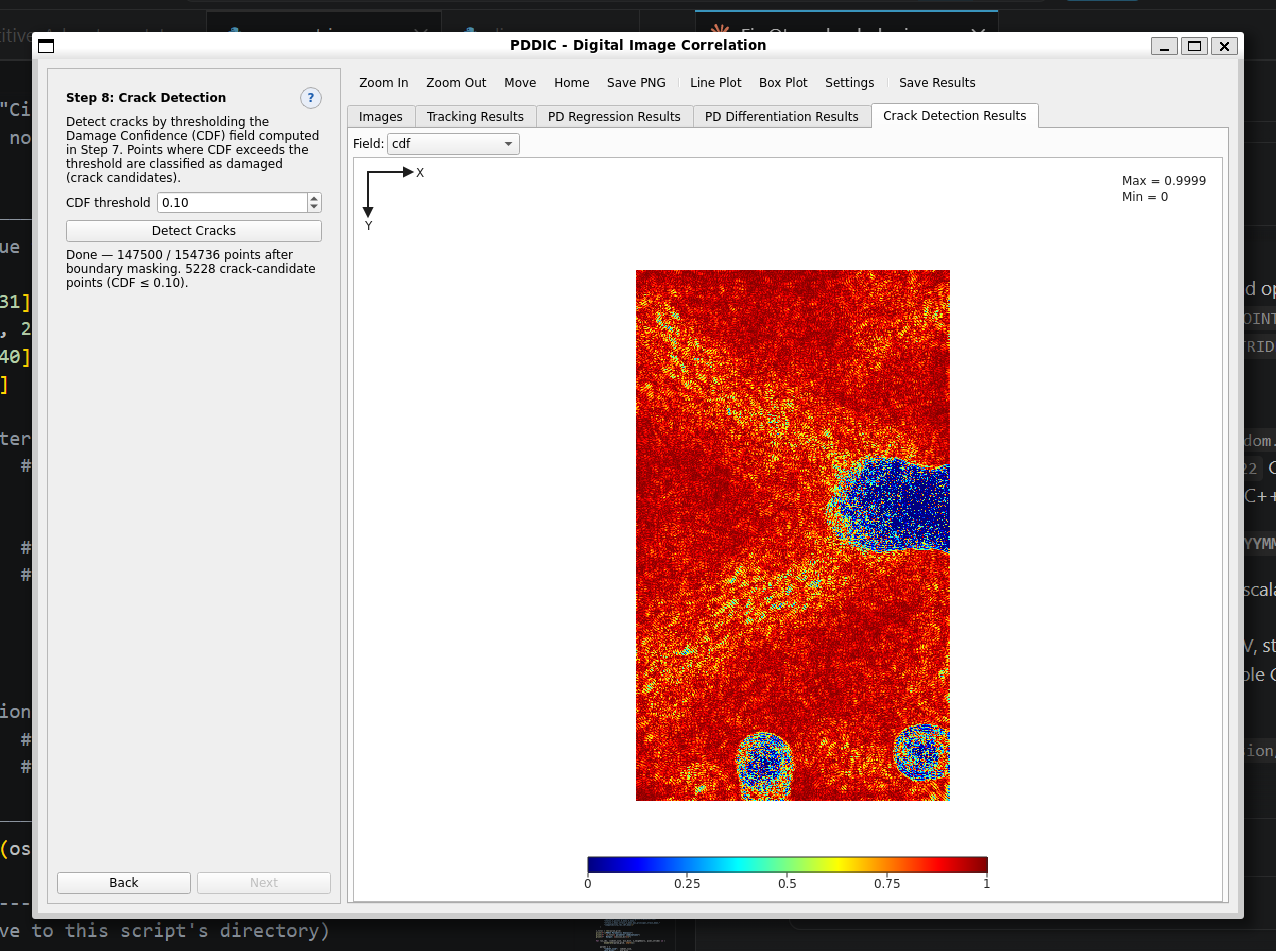 Step 8. The CDF map. Low values (blue) are statistically extreme — high-probability damage.
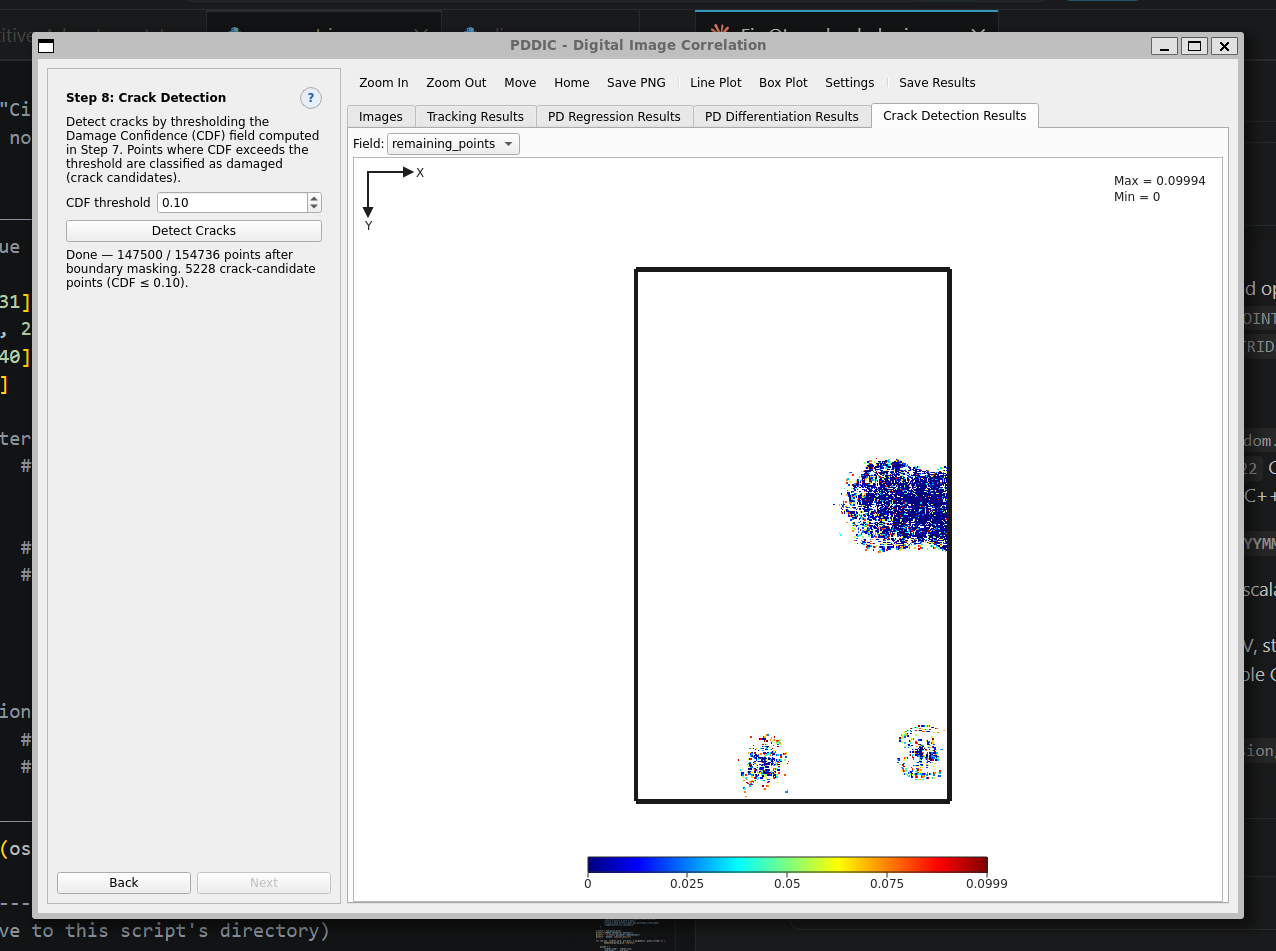 Step 8. Crack candidates surviving boundary masking and CDF thresholding.
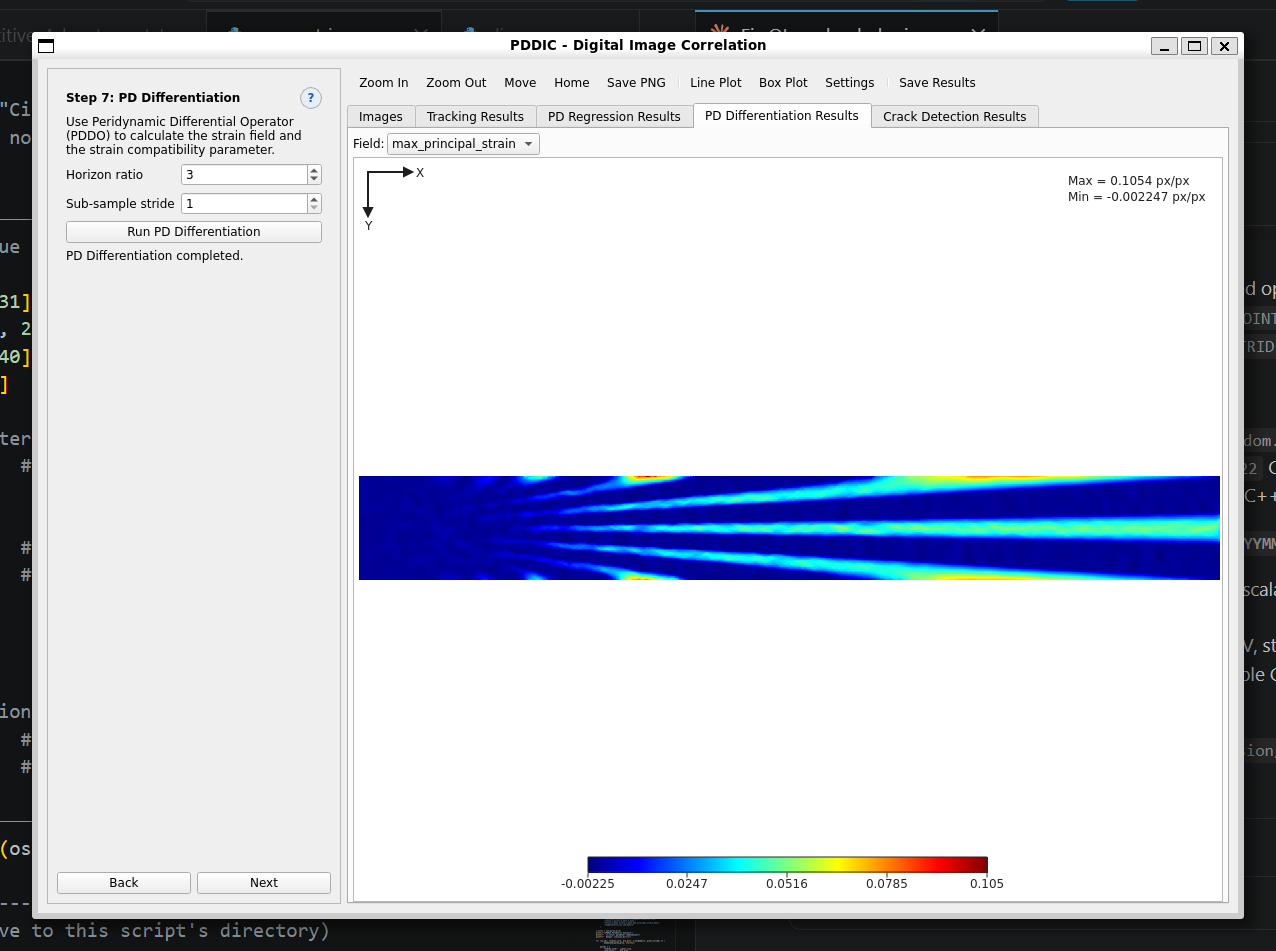 Step 7. Maximum principal strain across the gauge section — the localisation bands that the compatibility test turns into damage probability.
Who Is It For
- Experimental mechanics labs — characterise materials under load without contact sensors
- Structural integrity engineers — in-situ crack monitoring under fatigue or quasi-static loading
- NDE and NDT laboratories — automated, repeatable crack detection from routine DIC footage
- Fracture mechanics researchers — direct crack path input for SIF and J-integral calculations
- Industrial quality control — locate crack initiation sites with no additional hardware
All Products